


You don’t need to be a seasoned data scientist or have a degree in graphic design in order to create incredible data visualisations.
Via Baiba Svenca
Get Started for FREE
Sign up with Facebook Sign up with X
I don't have a Facebook or a X account


 Your new post is loading...
 Your new post is loading...
Your new post is loading...
You don’t need to be a seasoned data scientist or have a degree in graphic design in order to create incredible data visualisations. Via Baiba Svenca
Alfredo Corell's insight:
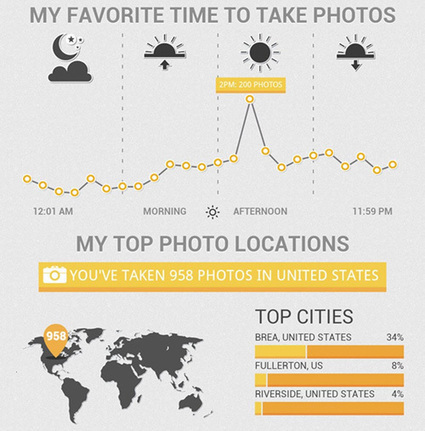
A super list of tools for creating digital content (infographics, word clouds, conceptual maps, chartas, etc...) for your Digital presentations. 

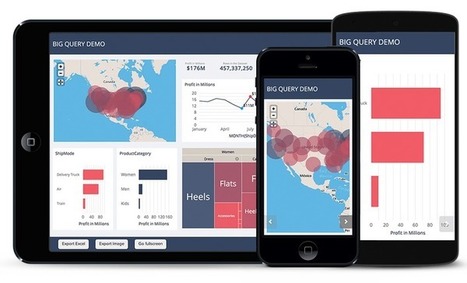
From simple charts to complex maps and infographics, Brian Suda's round-up of the best – and mostly free – tools has everything you need to bring your data to life... A common question is how to get started with data visualisations. Beyond following blogs, you need to practice – and to practice, you need to understand the tools available. In this article, get introduced to 20 different tools for creating visualisations... Via Lauren Moss, Baiba Svenca

Randy Rebman's curator insight,
January 28, 2013 12:33 PM
This looks like it might be a good source for integrating infographics into the classroom. |

Two Pens's curator insight,
May 13, 2013 1:14 PM
Piktochart is easy to work with and creates a fair Infographic. I still prefer to hire an art director. It's worth the money to have an intelligent designer with you :-) 
Eddie Thornton's curator insight,
May 13, 2013 3:29 PM
Don't forget to add your perspecitve, your insight as to why this infographic add up to more than just numbers and figures on a chart. 
Ness Crouch's curator insight,
May 14, 2013 4:09 PM
Another great link to help create infographics. I'd like to get more time to create these for class... |


Ca donne envie d'essayer : nuage de mots, graphiques, cartes... Par Christopher Ratcliff @ Econsultancy publié le 25/02
Check out how to add visualisations to your presentations.
197